
E-commerce · Shopify SEO
Vaultvapes: Top-10 Product Rankings and a PageSpeed Lift From 8 to 87
A Shopify storefront with 193,000 impressions and a 1.5% click-through rate. The record shows four product keywords inside the top 10 in Moz, and the homepage moving from a mobile PageSpeed score of 8 to 87.
Project overview
Vaultvapes is a Shopify storefront selling vape hardware and e-liquids. In early 2021 it had a familiar e-commerce problem in an unusually severe form: Google was showing its pages, but not high enough and not to enough people.
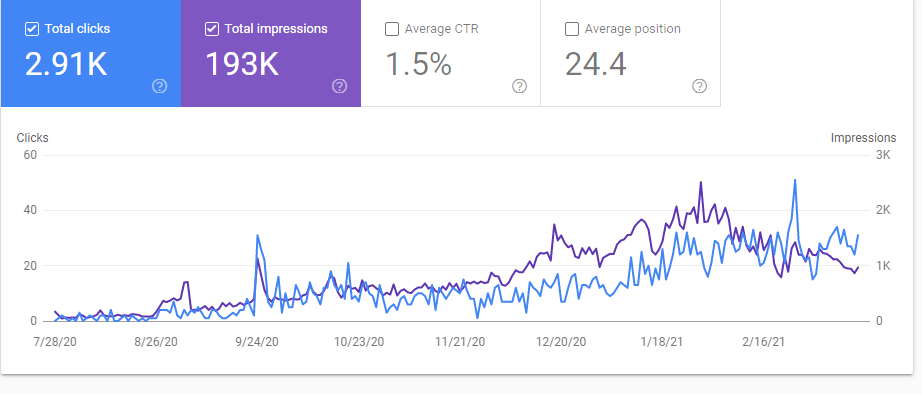
Search Console recorded 193K impressions and 2.91K clicks over six and a half months, a 1.5% click-through rate and an average position of 24.4. In plain terms, the average ranking sat on page three.
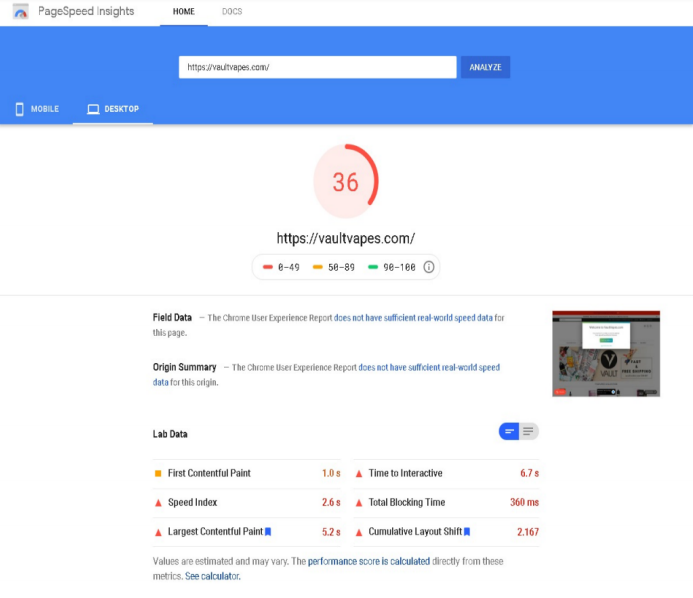
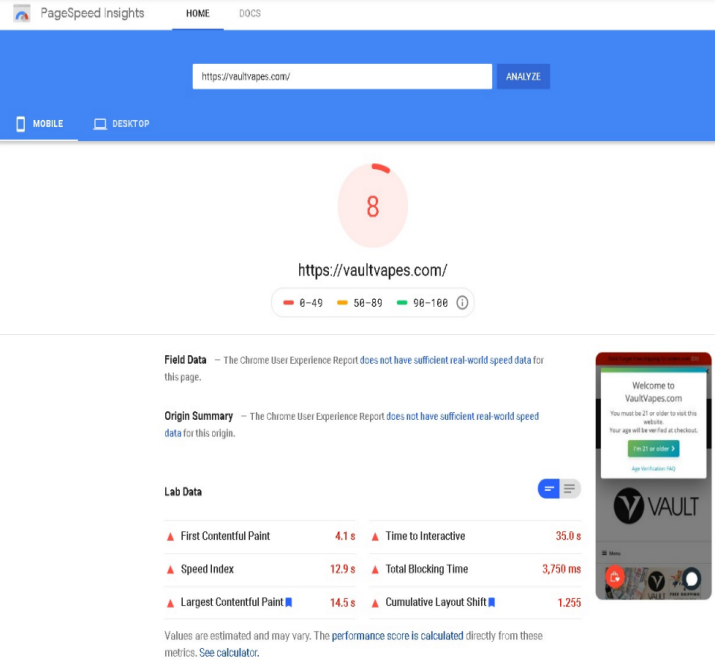
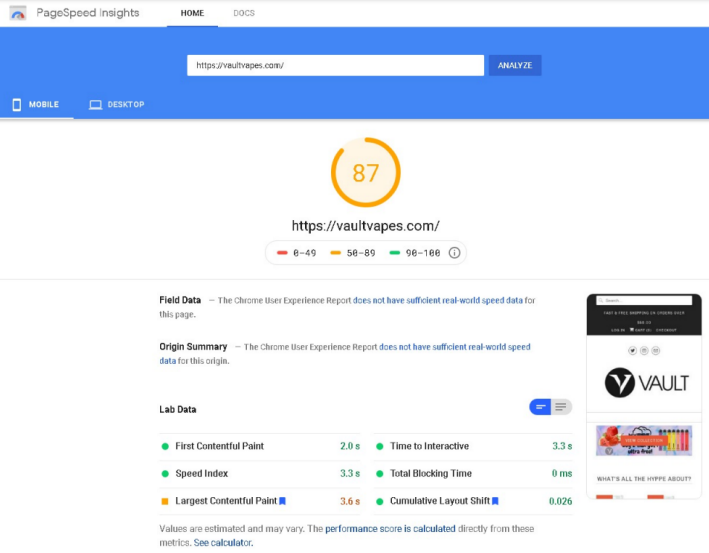
The storefront was also slow. PageSpeed Insights scored the mobile homepage 8 out of 100 and the desktop homepage 36 out of 100. Mobile lab data showed a 14.5-second Largest Contentful Paint, a 35-second Time to Interactive and a Cumulative Layout Shift of 1.255.
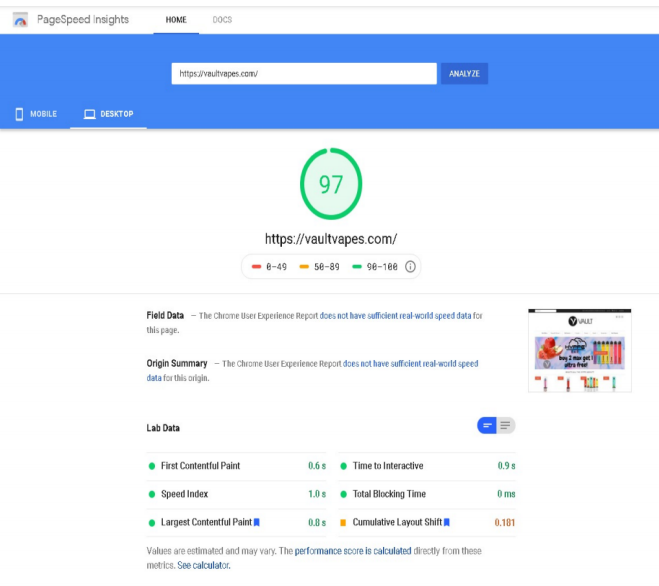
The engagement combined product-page SEO with technical performance work. By the end of the evidence window, four product keywords were tracking inside the top 10 in Moz, and the homepage scored 97 on desktop and 87 on mobile.
Industry and services
Vaultvapes sells vape hardware and e-liquid in a category where product-name searches carry the commercial intent. The store competes for brand and specification queries, not just broad category terms.
| Industry | E-commerce, vape retail |
|---|---|
| Platform | Shopify |
| Market | United States-facing. Moz tracks the keywords as “National” on Google en-US; Shopify reports in USD. The country of operation is not confirmed in the archive. |
| Services documented | Search engine optimisation, technical page-speed work |
| Evidence set | Search Console, Moz, PageSpeed Insights, Shopify, Google Search |
Business challenge
Impressions without clicks
The Search Console chart covers 28 July 2020 to 16 February 2021. It shows a store that was being indexed and surfaced, with impressions climbing through December 2020 and January 2021, but clicks stayed low relative to that reach. At a 1.5% CTR, roughly 98.5% of the impressions in that window did not produce a click.
Average position 24.4 explains why. A page-three result can accumulate impressions without ever entering the consideration set. The store did not have a visibility problem in the broad sense. It had a position problem, and a title-and-snippet problem downstream of it.
A slow storefront on the device that mattered
The PageSpeed captures are the most dramatic evidence in the archive:
| Lab metric | Desktop before | Desktop after | Mobile before | Mobile after |
|---|---|---|---|---|
| Performance score | 36 | 97 | 8 | 87 |
| Largest Contentful Paint | 5.2 s | 0.8 s | 14.5 s | 3.6 s |
| Time to Interactive | 6.7 s | 0.9 s | 35.0 s | 3.3 s |
| Total Blocking Time | 360 ms | 0 ms | 3,750 ms | 0 ms |
| Cumulative Layout Shift | 2.167 | 0.181 | 1.255 | 0.026 |
PageSpeed Insights, homepage. Lab data; field data was unavailable in both captures.
The before captures describe a store that was effectively unusable on a mid-range phone: 14.5 seconds before the main content rendered, 35 seconds before the page became interactive, and a layout that moved enough to cause mis-taps. For an e-commerce site, those are not technical footnotes. They sit between a visitor and the add-to-cart button.
A product-name market
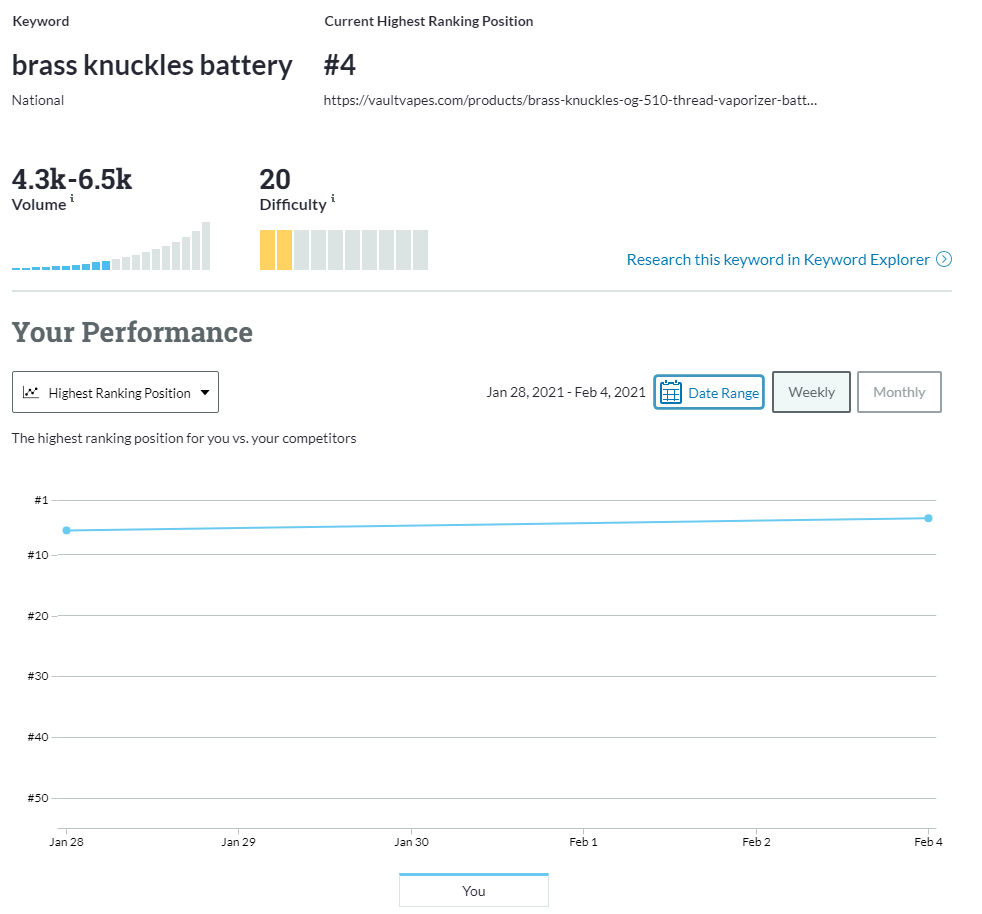
The ranking evidence centres on the “brass knuckles” product line, not on the Vaultvapes brand. Moz records 4.3k–6.5k monthly volume and keyword difficulty 20 for “brass knuckles battery”, plus three related variants. The store had to win product-name demand against other retailers, not rely on brand demand.
Commercial context, stated carefully
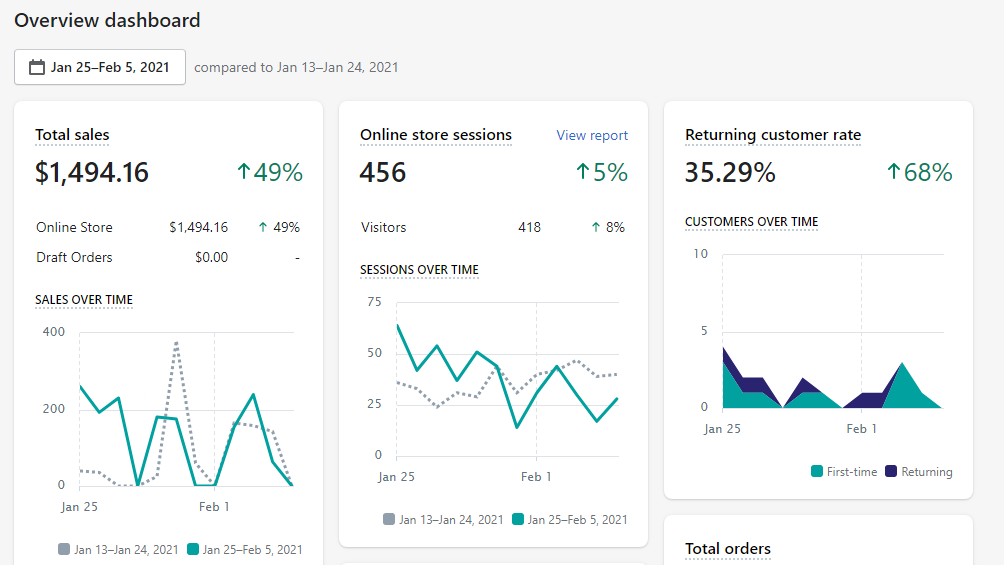
The Shopify overview compares 25 January–5 February 2021 with 13–24 January 2021: total sales $1,494.16, up 49%; sessions 456, up 5%; returning customer rate 35.29%, up 68%.
This is a twelve-day comparison with no control group. It is reported as a commercial indicator from the engagement window, not as proof that SEO or speed work caused the change.
Objectives
The original brief is not in the archive. These objectives are reconstructed from the artefacts and must be confirmed before publication.
- Move high-intent product-line queries from page two and three into the top 10.
- Improve the storefront’s Core Web Vitals, with mobile as the priority.
- Convert existing impressions into clicks through better titles and snippets.
- Keep every claim tied to a dated, reproducible source.
Strategy
1. Concentrate the keyword cluster on one product URL
The Moz captures show the same landing page ranking for all four “brass knuckles” terms: vaultvapes.com/products/brass-knuckles-og-510-thread-vaporizer-batt.... The effect is a concentrated pattern: brand, product and capacity variants resolve to one product page rather than being spread across category pages.
The trade-off is concentration risk: one URL carries the cluster, so a template change, stock-out or canonical error affects all four rankings at once.
2. Build product titles around the search phrase
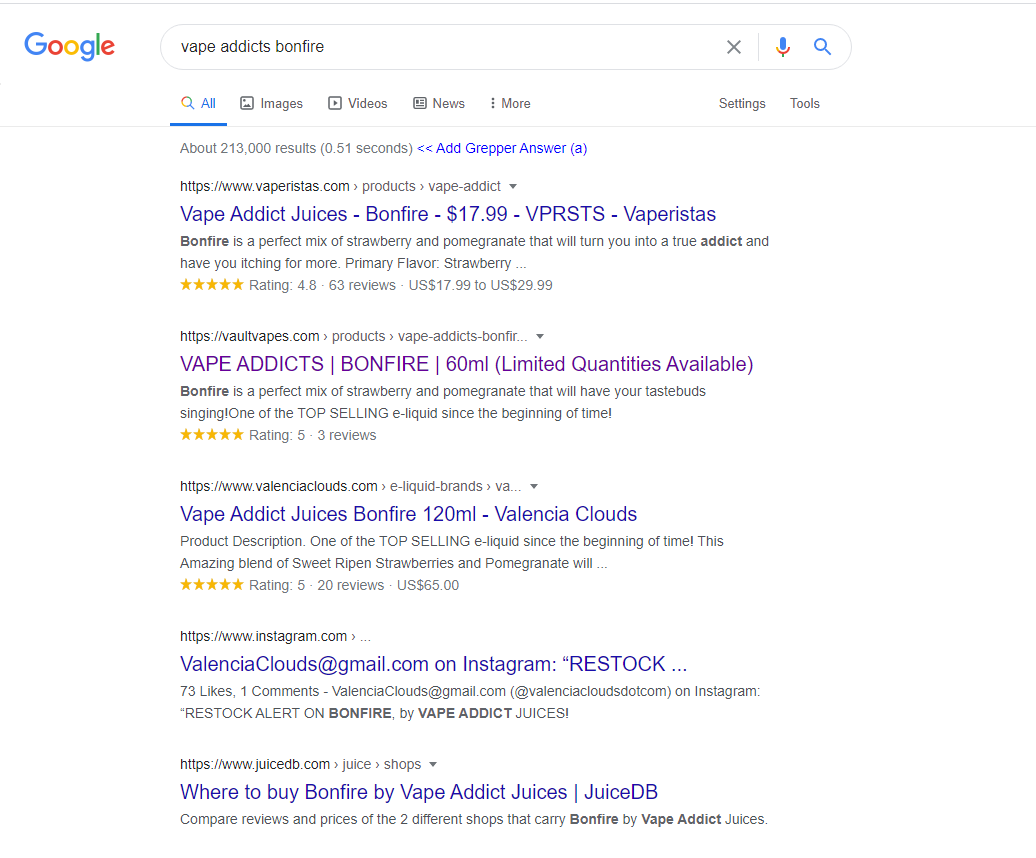
The Google SERP capture for “vape addicts bonfire” shows a product title written as “VAPE ADDICTS | BONFIRE | 60ml (Limited Quantities Available)”. The pattern is keyword-first: brand, product, size, availability. The URL follows the same logic.
3. Treat speed as a template problem
The before and after PageSpeed captures are of the homepage, not a single product page. That points to storefront-level work rather than a one-off page fix. The archive documents the outcome at metric level, not the change log. Which apps were removed, which scripts were deferred and which images were recompressed is not recorded.
4. Measure in three layers
Search Console for impressions, clicks and average position. Moz for keyword-level positions, volume and difficulty. Shopify for the commercial indicator. No layer is asked to prove more than it can.
Solution and implementation
Product-page architecture
The visible work is a tight mapping between search demand and one commercial page:
| Keyword (Moz) | Volume | Difficulty | Landing page | Position |
|---|---|---|---|---|
| brass knuckles battery | 4.3k–6.5k | 20 | /products/brass-knuckles-og-510-thread-vaporizer-batt... | #4 |
| brass knuckles vape battery | 851–1.7k | 22 | Same product page | #5 |
| brass knuckles og | 851–1.7k | 22 | Same product page | #8 |
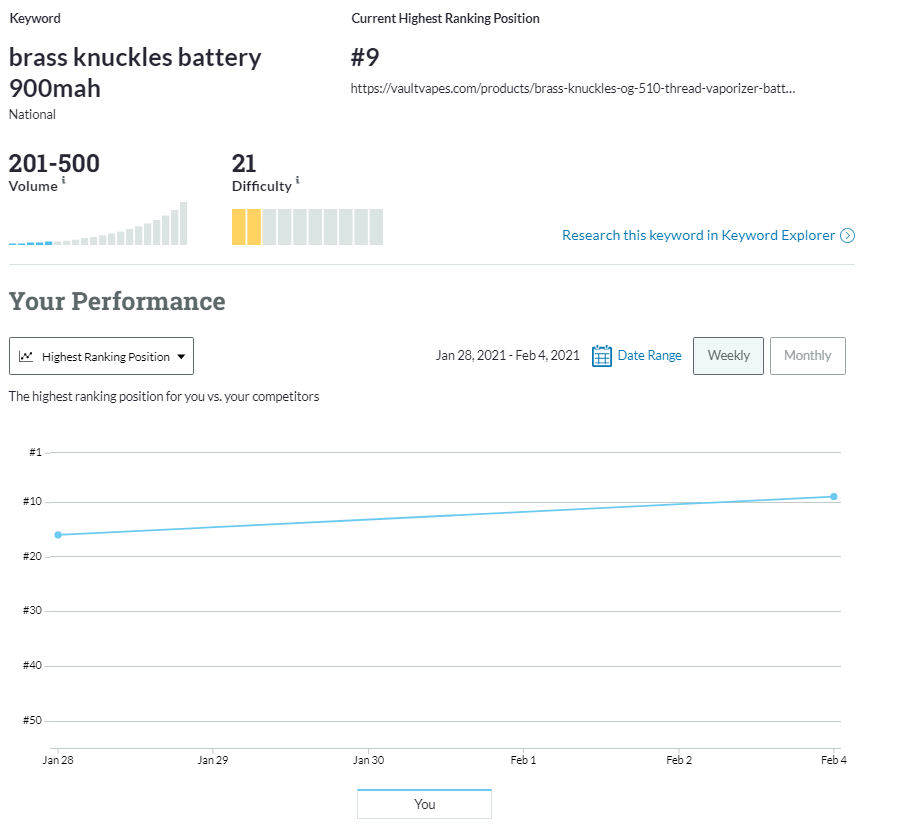
| brass knuckles battery 900mah | 201–500 | 21 | Same product page | #9 |
Moz, 28 January–4 February 2021. The 900mah chart starts near position 17 on 28 January and reaches #9 by 4 February.
On-page pattern
The evidence supports a consistent title pattern rather than a full on-page audit: product name first, specification second; pipe separators for scannability; a commercial qualifier where stock allows; a clean, keyword-bearing product URL. The archive does not contain the meta descriptions, heading structure, internal links or schema for these pages.
Technical performance
The before/after captures document a large shift in lab metrics. The homepage went from a failing mobile score (8) to a passing one (87). Total Blocking Time fell to 0 ms on both devices. Layout shift fell from 1.255 to 0.026 on mobile. Largest Contentful Paint fell from 14.5 s to 3.6 s on mobile.
What cannot be said: which specific fixes produced those changes. The archive has the “after”, not the tickets.
What is documented, and what is not
The record proves the outcome. It does not contain a delivery log, a ticket list or a change history. The implementation section therefore stops at the metric level; the specific fixes are not documented in the archive.
Project gallery
Every image is an original capture. Captions name the tool, the period and the metric.
PageSpeed: desktop before and after
PageSpeed: mobile before and after
Rankings, visibility and the commercial indicator
Results and evidence
| Result | Value | Source | Period |
|---|---|---|---|
| Desktop PageSpeed | 36 → 97 | PageSpeed Insights | Undated capture |
| Mobile PageSpeed | 8 → 87 | PageSpeed Insights | Undated capture |
| Mobile LCP | 14.5 s → 3.6 s | PageSpeed Insights | Undated capture |
| Mobile Total Blocking Time | 3,750 ms → 0 ms | PageSpeed Insights | Undated capture |
| Mobile CLS | 1.255 → 0.026 | PageSpeed Insights | Undated capture |
| “brass knuckles battery” | #4 | Moz | 28 Jan–4 Feb 2021 |
| “brass knuckles vape battery” | #5 | Moz | 28 Jan–4 Feb 2021 |
| “brass knuckles og” | #8 | Moz | 28 Jan–4 Feb 2021 |
| “brass knuckles battery 900mah” | #9, from ~#17 | Moz | 28 Jan–4 Feb 2021 |
| “vape addicts bonfire” | #2 organic | Google SERP | Undated |
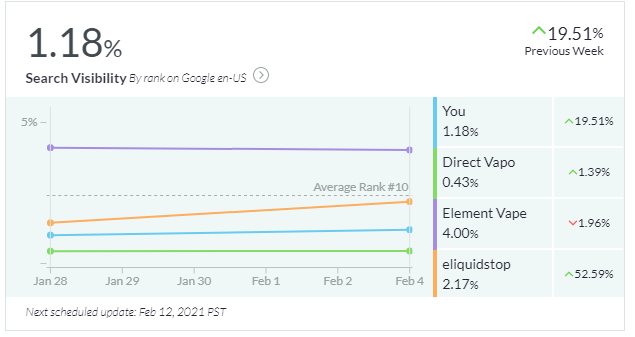
| Search visibility | 1.18%, +19.51% WoW | Moz | Week ending 4 Feb 2021 |
| Search Console total | 2.91K clicks / 193K impressions | Search Console | 28 Jul 2020–16 Feb 2021 |
| Shopify sales | $1,494.16, +49% | Shopify | 25 Jan–5 Feb 2021 |
Reading the numbers honestly
The PageSpeed scores are lab scores. Both captures say the Chrome User Experience Report did not have enough real-world data for the page. Lab tests are useful for diagnosing a template, but they do not tell you how customers experienced the store on their own connections.
The Search Console average is not a baseline. The 24.4 average covers six and a half months. The February rankings are a later, narrower snapshot. Comparing the two directly would overstate the change.
Visibility is still low in absolute terms. Moz visibility of 1.18% is early-stage. The week-over-week gain of 19.51% is the signal; the absolute number is a reminder of how much headroom remained.
The sales comparison cannot carry a causal claim. Twelve days, one store, no control group, a small base. Report it as a commercial indicator and say so in the same paragraph.
What the evidence does not show
A case study is only as useful as its weakest number.
These are the questions this evidence cannot answer. They are listed here so the reader does not have to discover them.
- No starting positions for three of the four keywords.
- No click, conversion or revenue attribution by channel.
- No field speed data (CrUX or GA4).
- No dates on the PageSpeed captures.
- No documented list of the speed fixes delivered.
- No confirmation that the store’s market is the United States, only that the dashboard and Moz locale point that way.
- No engagement start or end date.
Key learnings
Impressions are not the bottleneck when average position is 24
The store had 193K impressions. The constraint was where those impressions appeared. Position and snippet quality decide whether reach becomes a click.
One page can own a cluster, but it concentrates risk
Mapping four variants to one product URL is efficient. It also means a single template or stock issue can take out the whole cluster. The case study should name the trade-off, not just the win.
Speed scores are a diagnostic, not a business result
The jump from 8 to 87 is a useful signal about the template. The more meaningful numbers are the underlying metrics: 14.5 s to 3.6 s LCP, 35 s to 3.3 s TTI, 1.255 to 0.026 CLS. Those describe what a user was waiting for.
Short-window commercial data should be labelled as such
The 49% sales increase is real in the dashboard. It is also a twelve-day comparison. A case study that presents it as the headline invites the reader to doubt everything else.
Related services
- Search engine optimisation — technical SEO, on-page work and keyword mapping.
- E-commerce development — Shopify storefront work and conversion-focused builds.
FAQs
How long did the engagement take?
The archive does not record start or end dates. The evidence spans July 2020 to February 2021, but that is the dashboard window, not the contract period.
Did the SEO work cause the 49% sales increase?
No causal claim is made. The Shopify comparison covers twelve days and has no control group. It is reported as a commercial indicator alongside the ranking and speed evidence, not as proof of cause.
What was the starting position for “brass knuckles battery”?
The archive does not contain a baseline capture for that term. It shows #4 during 28 January–4 February 2021. The only within-week movement visible is the 900mah variant, which rose from roughly #17 to #9.
Is a 97 PageSpeed score realistic for a Shopify store?
This capture shows 97 on desktop and 87 on mobile for the Vaultvapes homepage. Scores vary with theme, apps, third-party scripts, images and the test environment. The number should not be presented as a universal Shopify benchmark.
Can this approach work for a store in a different category?
The method — one page per keyword cluster, keyword-first product titles, template-level performance work, three-layer measurement — is transferable. The results will depend on competition, catalogue structure and the store’s starting position.
Getting impressions but not clicks?
If Search Console shows reach and your average position sits on page two or three, the problem is usually fixable. Send DMA the property and the product pages that matter most.